Analysis of Hate Speech by Age-Gender Group with kcELECTRA
Natural Language Processing
Date : 2023.08.07
Writer : 9tailwolf
Caution :
- Every codes and images are made by
9tailwolf. For personal use only. - Every datas are made by Matplotlib in Python and Numbers.
- The result is not be precised due to uneven data.
Timeline :
- Setting a Record for Kaggle Hate Speech Detection
- Data Collection by Web Crawling
- Making Language Model for Hate Speech Type Determination
- Apply the model and Analyze the Results
Introduction
Today, In online community, there is a numerous hate with many types. And many people say that solving the problem of hatred in our society is an important task. Research on hate contributes to solving these problems. In this study, I analyze the distribution of hate by online community according to age-gender and type with language model.
How to Choose Community
Trend Searching was used to identify communities that well represent the characteristics of each age group. Blackkiwi is a most useful site for searching Korean searching trends.
The target age/gender group of communities that I want to collect is 2030s male, 3040s male, 4050s male, 2030s female, 3040s female, 4050s female.
As a result I could select 6 communities.
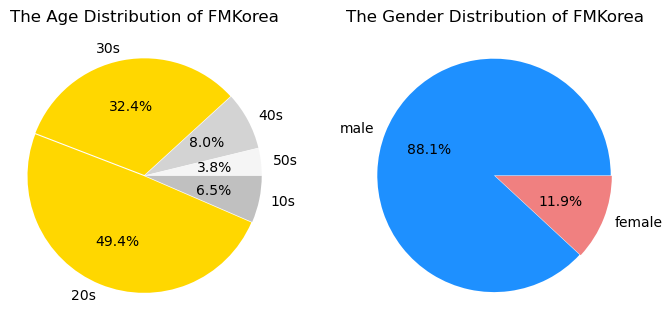
- 81.8% of 2030s, 88.1% of male : FMkorea
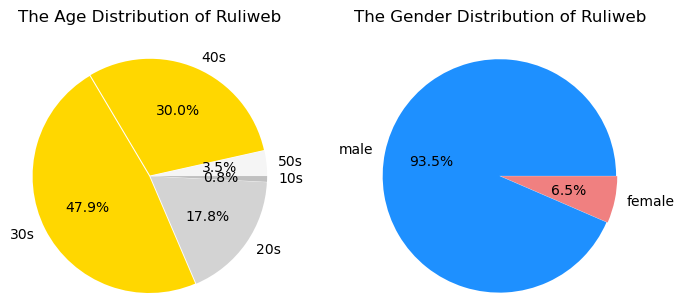
- 78.1% of 3040s, 93.5% of male : Ruliweb
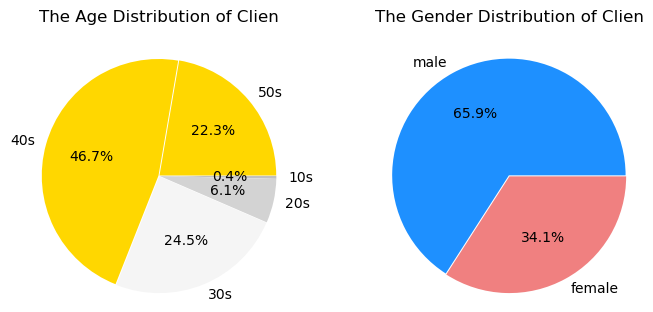
- 69.0% of 4050s, 65.9% of male : Clien
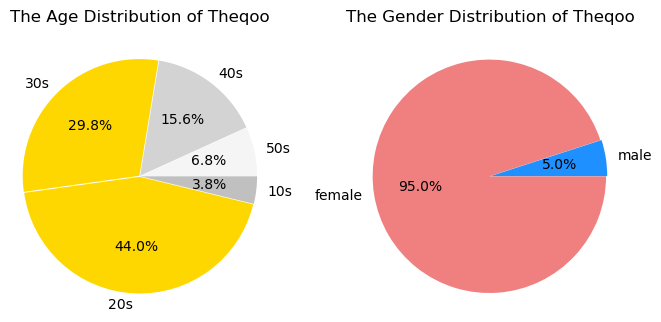
- 73.8% of 2030s, 95.0% of female : Theqoo
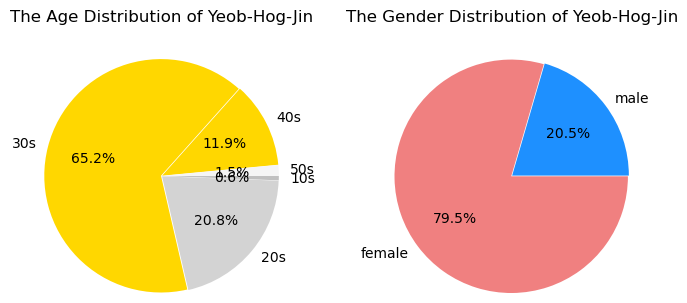
- 77.2% of 3040s, 79.5% of female : Yeobgi-Hogeun-Jinsil
- 88.1% of 4050s, 95.2% of female : 82cook

Language Model
CNN with hidden layer of kcELECTRA were most suitable at hate speech detection. Below is a source code of language model.
class KcELECTRA_CNN3(nn.Module):
    def __init__(self, len_size, kernal, filter_size, stride, labels, active):
        super(KcELECTRA_CNN3,self).__init__()
        self.KcELECTRA = AutoModel.from_pretrained("beomi/KcELECTRA-base", output_hidden_states=True)
        self.Dropout_default = nn.Dropout(0.1)
        self.Convs = nn.ModuleList([nn.Conv2d(in_channels = 3, out_channels = filter_size, kernel_size = (i,768), padding = ((i-1)//2,0)) for i in kernal])
        self.Relu = nn.ReLU()
        self.Pooling = nn.MaxPool1d(kernel_size=len_size//stride, stride = stride, padding = (len_size//stride-1)//2)
        self.Flat = nn.Flatten()
        self.Linear = nn.Linear(len_size // stride * len(kernal) * filter_size , labels)
        self.Active = active


    def forward(self, input_ids, attention_mask=None, token_type_ids=None):
        output = self.KcELECTRA(input_ids=input_ids, attention_mask=attention_mask, token_type_ids=token_type_ids)[1][-3:]
        output = torch.transpose(torch.cat(tuple([t.unsqueeze(0) for t in output]), 0),0,1) # batch * 3 * encoder * 768
        x = [self.Relu(self.Dropout_default(Conv(self.Dropout_default(output)).squeeze(3))) for Conv in self.Convs]
        pool = torch.cat([self.Pooling(self.Dropout_default(i)) for i in x],1)
        flat = self.Flat(self.Dropout_default(pool))
        l = self.Linear(self.Dropout_default(flat))
        return self.Active(l)
I use Selectstar Open Datasets and Kocohub Datasets for training model. Selectstar datas are consist of 100,000 labeled text datas without netural datas. For the training dataset, clean sentences from Kocohub data, non-target hate data from Selectstar were labeled as 0, and 4000 targeted hate data from Selectstar were labeled as 1. Following is the structure of a training set.
-
Gender: 4514 target, 4000 non-target hate, 3486 clean data (98% of Accuracy) -
Age: 2135 target, 3379 non-target hate, 3486 clean data (96% of Accuracy) -
Obscenity: 2398 target, 4116 non-target hate, 3486 clean data (93% of Accuracy) -
Insult: 4514 target, 4000 non-target hate, 3486 clean data (91% of Accuracy) -
Disability: 1792 target, 2722 non-target hate, 3486 clean data (95% of Accuracy) -
Political: 4514 target, 4000 non-target hate, 3486 clean data (91% of Accuracy) -
Religion: 1177 target, 1337 non-target hate, 3486 clean data (99% of Accuracy) -
Race/Region: 4514 target, 4000 non-target hate, 3486 clean data (92 of Accuracy) -
Job: 4514 target, 4000 non-target hate, 3486 clean data (88% of Accuracy) -
Violence: 4514 target, 4000 non-target hate, 3486 clean data (89% of Accuracy)
The following is a parameters for Hate Speech Detection Model.
- len_size : 50
- kernal : (1,3,5)
- filter_size : 12
- stride : 8
- labels : 1
- active : nn.Sigmoid
Result Analysis by Age-Gender Group
To make the comparison easier, I set the range of the y-axis to between 0 and 0.1. However, in the items of Insult and Race/Region, the range of the y-axis was set between 0 and 0.2 according to the data results.
Hate Type : Gender
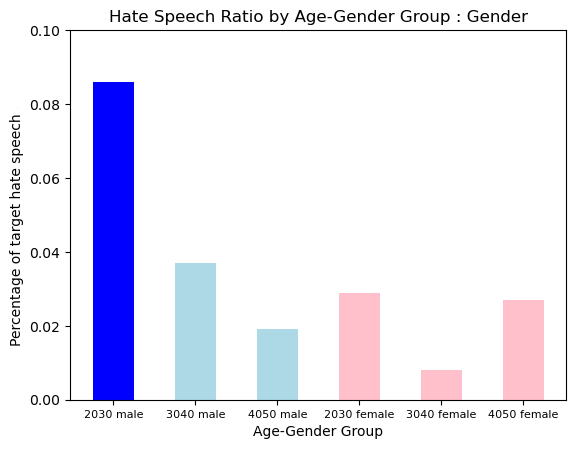
Gender Hate was more prevalent in Younger Group. In particular, the 2030s Male Group showed a uniquely a lot of hate.
Hate Type : Age
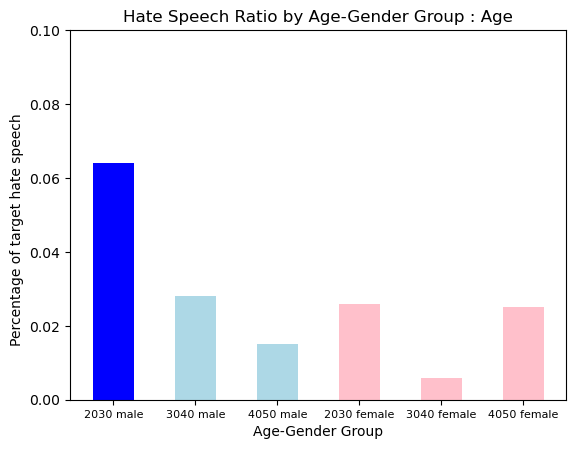
The pattern of Age Hate was simmilar as the pattern of Gender hate. It was also more prevalent in Younger Group, and the 2030s Male Group showed a uniquely a lot of hate.
Hate Type : Obscenity
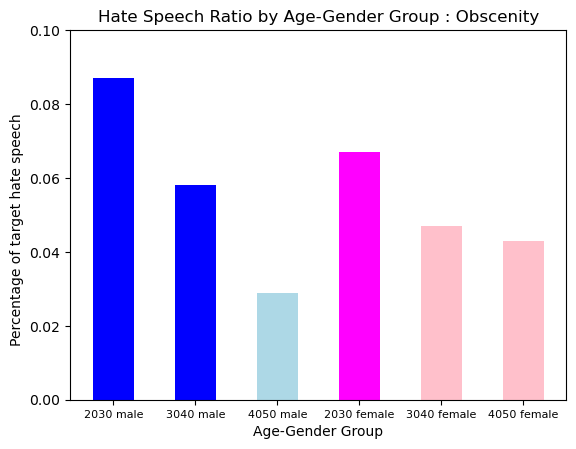
The pattern of Obscenity was also evenly distributed. It was a little bit more prevalent in 2030s, and 3040s male. In the younger group showed more Obscenity in male group, And the older group showed more Obscenity in women.
Hate Type : Insult
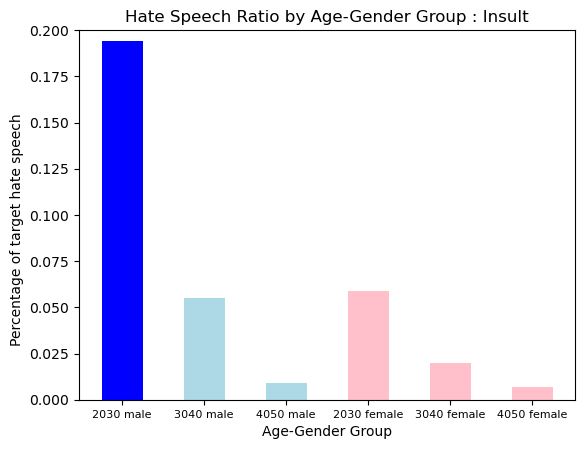
The pattern of Insult was also more prevalent in Younger Group, and the 2030s Male Group showed a uniquely a lot of that.
Hate Type : Disability
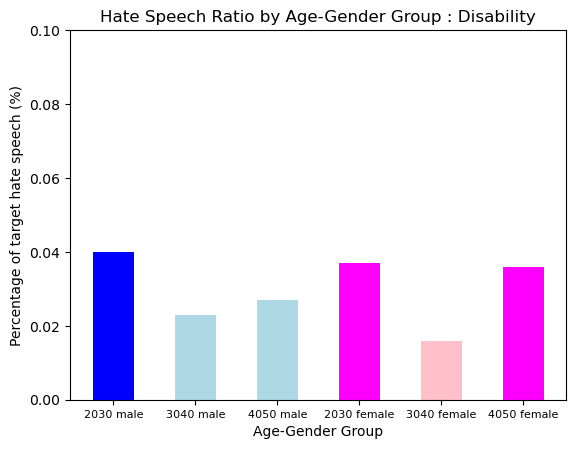
The pattern of Disability was also evenly distributed. It was a little bit more prevalent in 2030s, and 4050s female.
Hate Type : Political
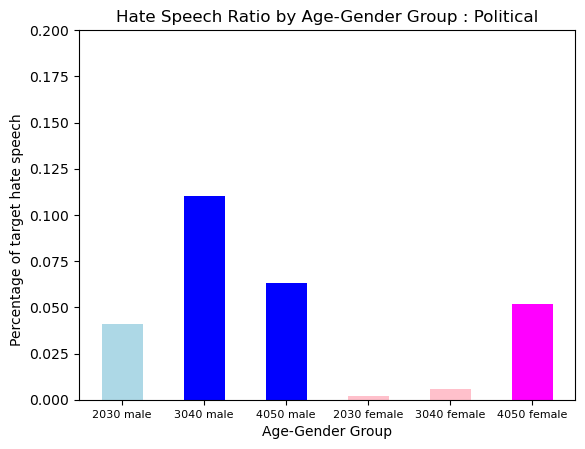
The pattern of Political Hate was shown more in older group. Especially, young female group seems to be shown very little hate but older group isn’t.
Hate Type : Religion
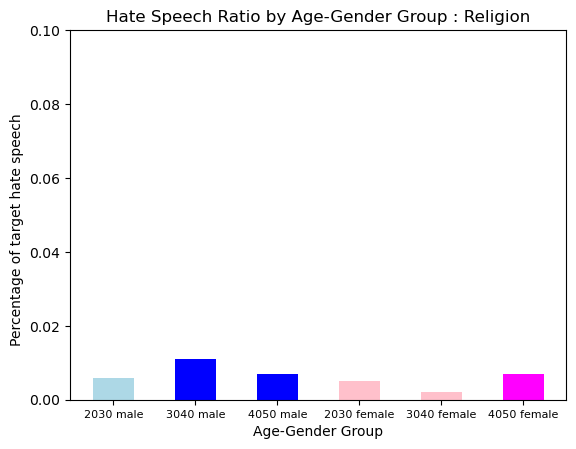
Religion Hate was more prevalent in Older Group, and Male Group. It was also a very small amount compared to other type of hate.
Hate Type : Race/Region
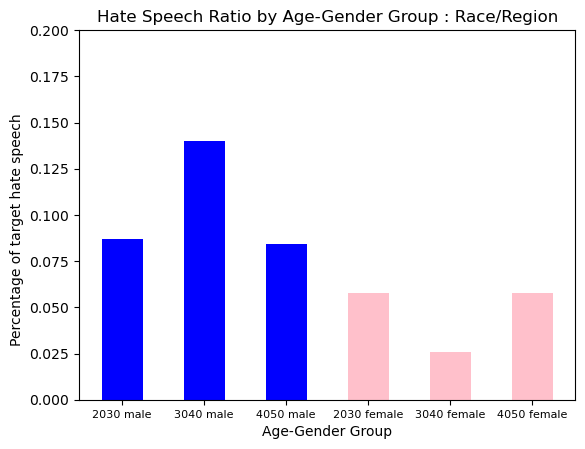
Race/Region Hate were also evenly distributed. But Accourding to gender, male groups showed a much higher prevalence.
Hate Type : Job
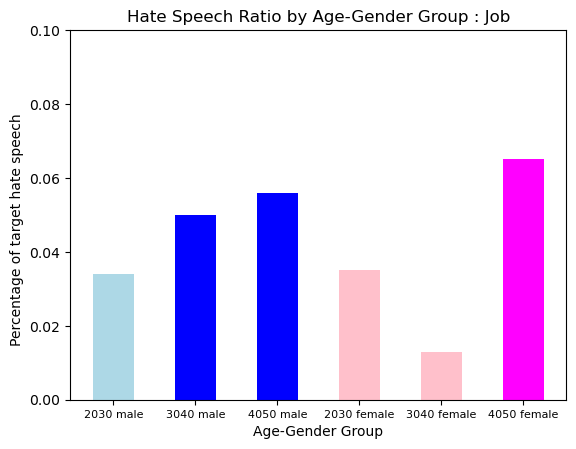
Job Hate was more prevalent in Older Group .
Hate Type : Violence
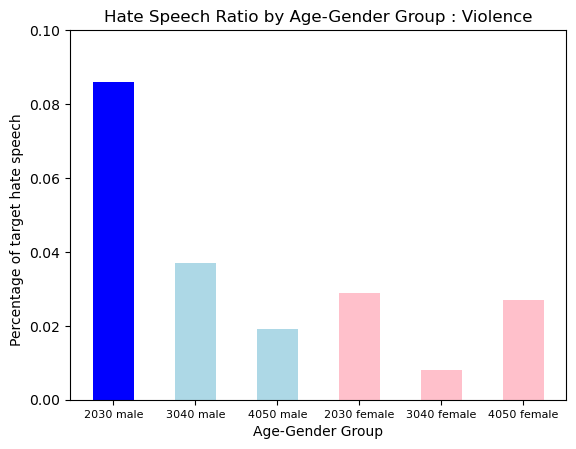
Violence was more prevalent in 2030s Male Group showed a uniquely a lot of hate.
Result Analysis by Type of Hate
To make the comparison easier, I set the range of the y-axis to between 0 and 0.1.
Age-Gender Group : 2030s Male
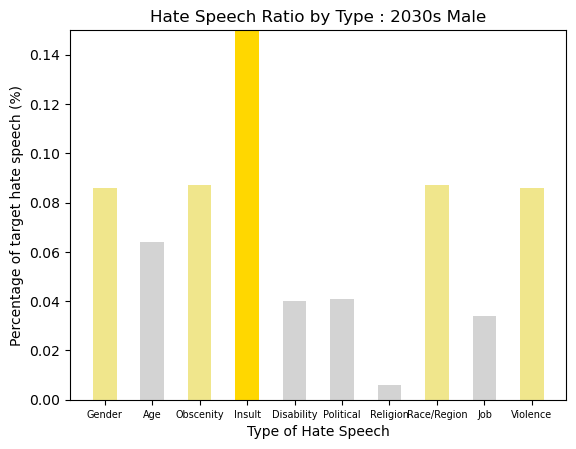
2030s Male is a group with the most numerous hate speech. For most types of hate, they showed more hate speech than average. There were so many Insult that made up around 20%, and the Gender Hate, Obscenity, Race/Region Hate, and Violance were more than 8%.
Age-Gender Group : 3040s Male
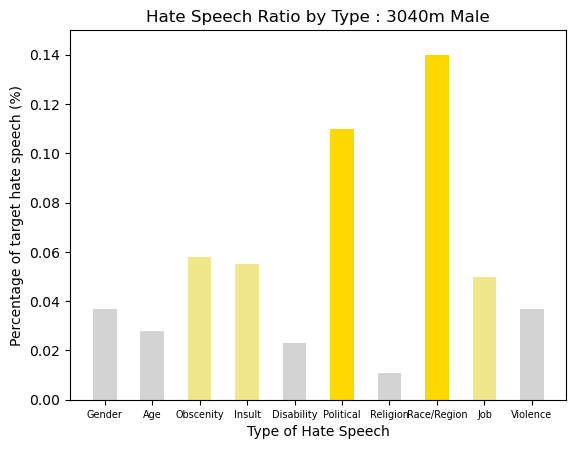
3040s Male shows the most numerous hate speech with Political and Race/Region. It is over 10% of the speechs. And the Obscenity, Insult, Job hate were around 6% of the speechs.
Age-Gender Group : 4050s Male
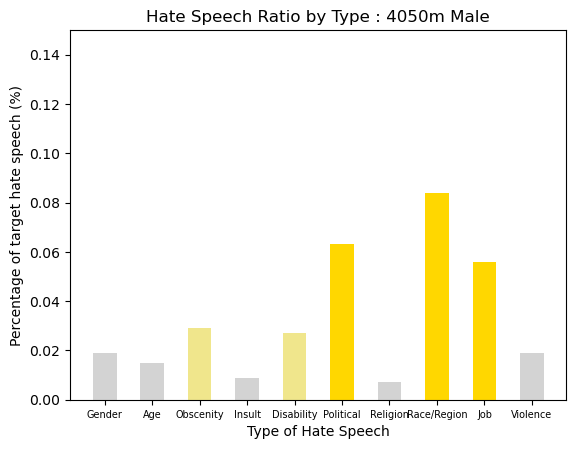
The distribution in hate type of 4050s Male was simmilar as 3040s Male group. Political and Race/Region with Job Hate were most. Other types of hate showed a distribution of about 2%.
Age-Gender Group : 2030s Female
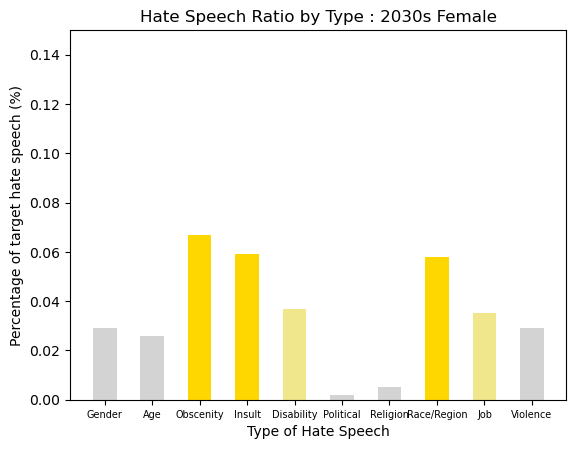
The distribution of 2030s Female was simmilar as 2030s male, but not for age hate and gender hate. Obscenity, Insult, and Race/Region were most with around 6% of speechs, but the others are around 3% of speechs.
Age-Gender Group : 3040s Female
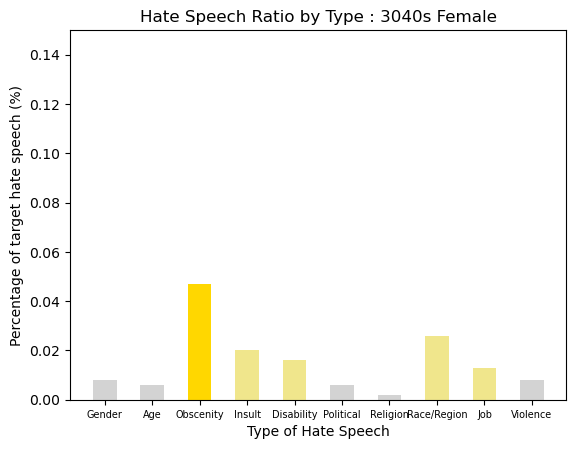
3040s Female was showns a group with the least hate speech. Just Obscenity was around 5% of speechs, but the others are around 2% of speechs.
Age-Gender Group : 4050s Female
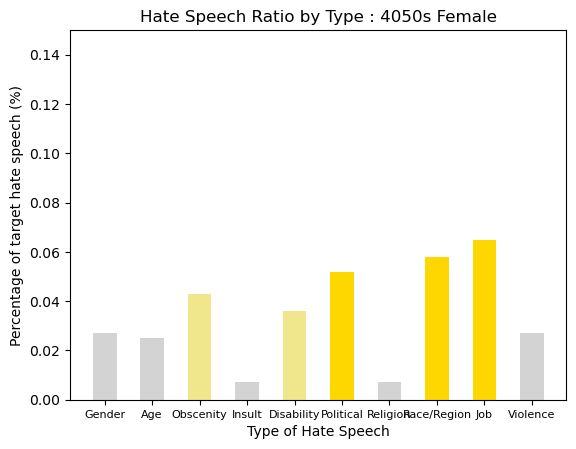
4050s Female was simmilar as 4050s male. It can be seen that the distribution or pattern is very similar. Political and Race/Region with Job Hate were most. Other types of hate showed a distribution of about 2%.
Conclusion
-
2030s Maleis a group with the most numerous hate speech. -
Gender Hate, Age Hate, Obscenity, Insult, Violence were higher in the
Younger Group -
Religion Hate, Job Hate, were higher in the
Older Group. - Obscenity, Insult, Political, Race/Region, Job were main type of hate Age and Religion were few type of hate.
-
Insult and Obscenity. It was confirmed as the
Younger the Group, theMore Differentdistribution in type of hate according to gender.